Market commentary and performance
Spring Term Investment Letter by Big Green Capital

This is the first investment letter of Big Green Capital — a club at Dartmouth where I serve as President. There are no biotech pitches not already mentioned on my Substack, but there are a couple of solid generalist ideas, seasoned with a bit of market commentary, mainly concerning AI.
Mission & Market Philosophy
Big Green Capital was founded as a student-run organization with a single objective: to teach undergraduate students how to invest by giving them hands-on experience managing a real portfolio. While we teach the analytical fundamentals, students are entirely responsible for their own independent idea generation and pitch execution. We then push the rest of the group to aggressively challenge each thesis. By being forced to defend their perception against peer critique, students learn to look beyond basic financials and diagnose the specific biases of market forces. This process builds an intuitive mental model of active market participants: the definitive end goal of our curriculum, and the single most critical capability in modern investing.
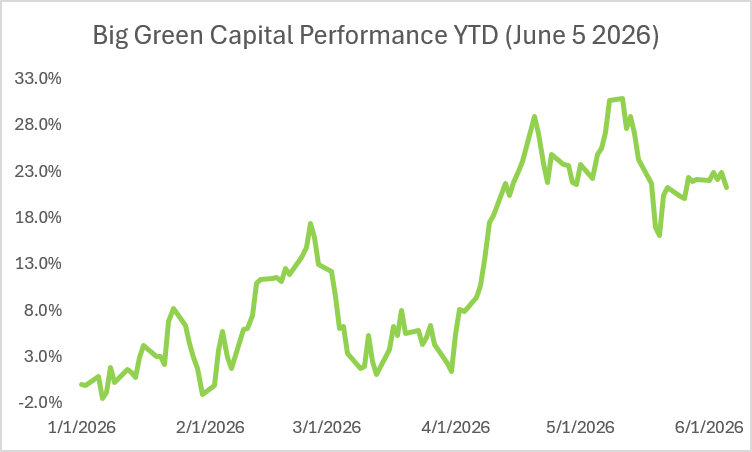
Big Green Capital launched its global long/short equity strategy on December 1, 2025. The portfolio has generated a year-to-date return of 21.2% as of June 5, 2026, representing a cumulative return of 25.82% since inception.
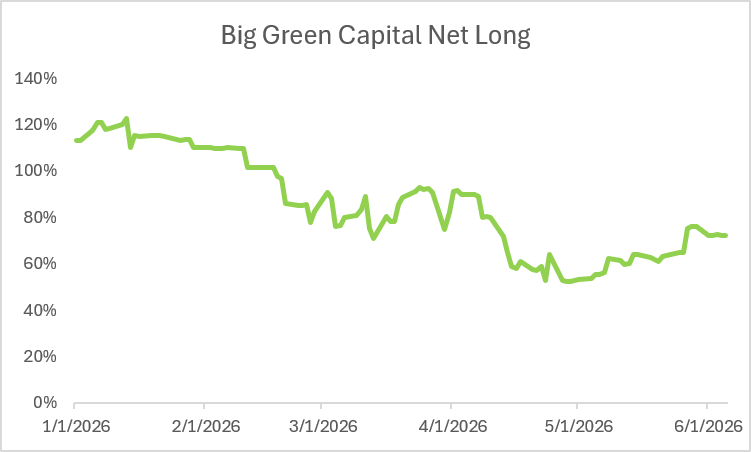
Our investable universe includes all equities available via Interactive Brokers. While our strict mandate is to operate with zero leverage—capping net long exposure at 100%—portfolio positioning temporarily exceeded this limit during the first two months of the year. We have since normalized our exposure and are actively targeting a net long position between 30% and 80%, managed at the discretion of the President. We strictly prohibit options and directly leveraged instruments like TQQQ.
Our investment philosophy is explicitly designed to exploit a permanent shift in modern market structure. Capital is increasingly concentrated within pods with quarter-to-quarter attention spans and tight risk controls, rendering them incapable of underwriting long-duration theses or betting in proportion to their conviction of magnitude of mispricing – all of which is required for efficient markets.
Concurrently, the expansion of passive investing and CTAs has introduced inelastic buying demand, oftentimes making liquid assets less efficiently priced than their small-cap counterparts, which lack inelastic flows.
When we ask who is on the other side of our trades, a satisfactory answer can no longer only be “a counterparty with inferior analytics”, but market structure-based explanations seem and often turn out to be correct.
The obvious is no longer obviously wrong in 2026.
The modus operandi of modern markets materially expands the opportunity set for our specific style of investing – a tailwind we expect will only accelerate.
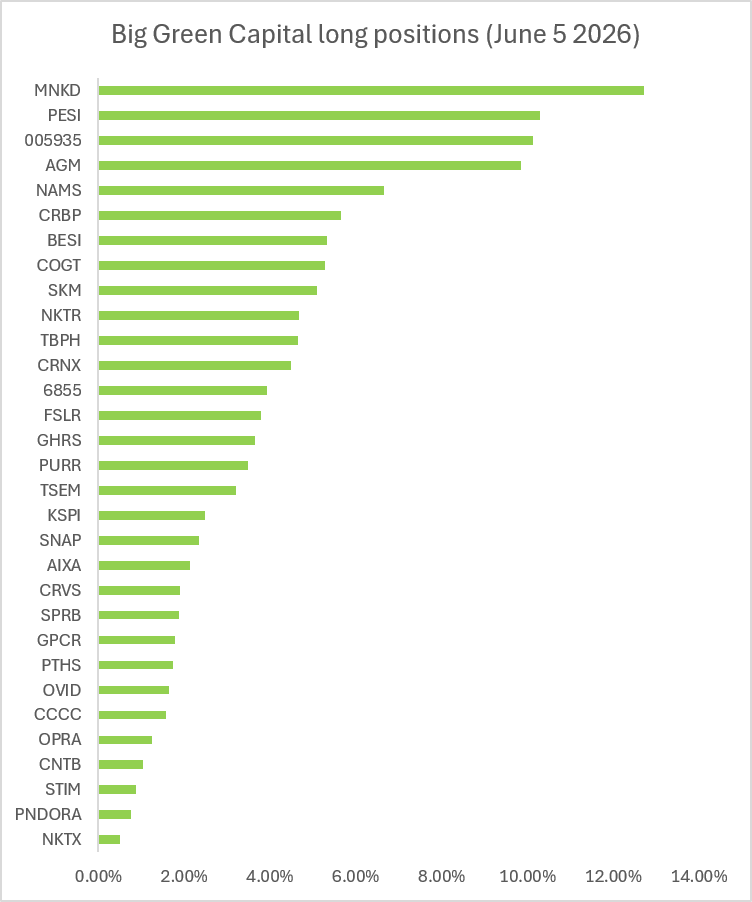
We target an annual portfolio turnover of 100% to 200% through a bifurcated approach to capital deployment. We allocate 80% of our book to catalyst-driven positions expected to materialize within 6-18 months ($CRBP) and market structure-driven overreaction mean reversals ($MNKD), reserving the remaining 20% for underpriced, long-duration compounders($AGM, $KASPI).
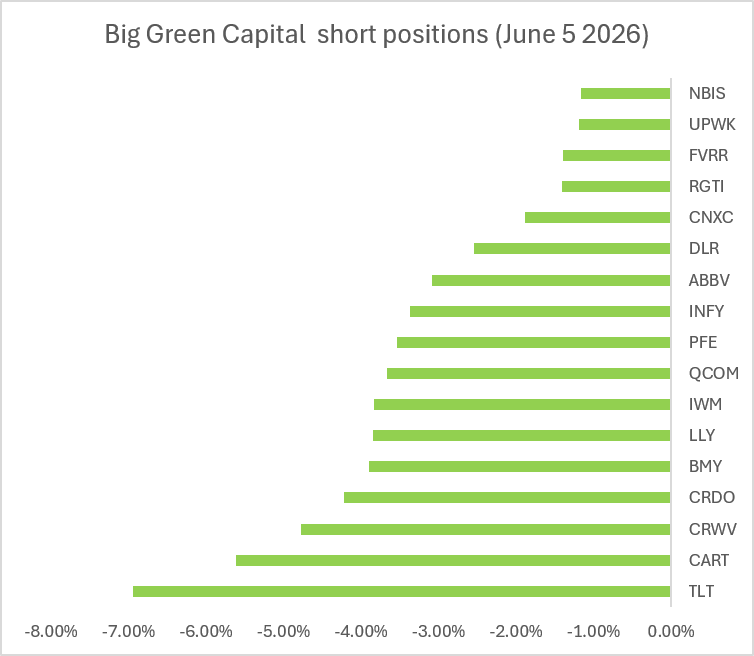
Our short book is utilized as a risk-management tool to neutralize factors that we do not want to place a directional bet on, and allow us to bet on the cross-sectional dispersion within that risk factor. For example, we do not claim an edge in predicting the exact duration of the semiconductor capex cycle, but we do feel comfortable in our ability of assessing the cross sectional valuations within the semiconductor value chain, and confidently say that valuations are incoherent across the sector.
We consciously accept the temporary basis risk created by short-term factor flows that might not match our categorization of factor exposures and thereby create short-term drawdowns in order to maintain protection against tail risks.
The amplitude of swings in our pair trades – long memory short neoclouds particularly – did catch us by surprise, and due to position oversizing we were forced to reduce exposure at the worst time.
A crucial takeaway was recognizing that an investor’s core market views are highly predictive of their other beliefs. We found that entirely unrelated trades can become highly correlated simply because they are owned by the same demographic of thinkers.
As an example, while the fundamental question of the semi trade is how much value AI labs will be able to capture, for consumer platforms the concern is that of consumer preferences in interacting with AI. While the ”answer” to these 2 are somewhat related, short platforms traded with long AI/semis factor with a correlation much higher than the interrelatedness of these 2 questions would justify. Consequently, we reduced our short platform exposure as soon as we recognised this fact.
Sector Allocation
We concentrate our capital in semiconductor and biotechnology industries. While the combination of these 2 might seem unconventional, these 2 industries complement each other, as at least one will benefit no matter how the AI trade ends up.
For simplification, let us crystallise AI’s impact on the economy into 3 scenarios:
If the anticipated AI productivity gains fail to materialize, the resulting collapse of the datacenter CapEx cycle, which already accounts for more than 2.5% of GDP, will trigger a recession and inevitable rate cuts, and biotechnology will further benefit from becoming the primary risk asset. Conversely, if AI scales as promised, structural deflation coupled with at least transitional unemployment will mandate aggressive rate cuts through a soft labour market and potential deflationary effects, benefitting the biotechnology sector.
Under the third scenario—a “middle path” where AI neither structurally transforms the economy nor does the AI factor stall—we believe the market can only remain in equilibrium temporarily. We are past the phase where the “AI will change the world” thesis is unfalsifiable; today, frontier labs’ revenue figures are anxiously scrutinized to see if they can justify their massive purchase obligations.
AI is perhaps the most reflexive trend in financial history. If frontier labs fail to scale revenue fast enough, they will at some point be starved of the capital required to satisfy their compute needs. They would then either be forced to divert compute away from R&D to increase ARR, slowing their rate of capability improvement. This would allow open-source models to close the gap, further compressing the frontier labs’ revenue growth and starving them of even more capital. Labs cannot simply prioritize R&D over commercialization, because the market’s core question has shifted from ‘Is economic surplus being created?’—which advances in capabilities undeniably prove—to ‘What fraction of that economic value can actually be captured?’ This is where a dangerous disconnect emerges. The observed input of actual Annual Recurring Revenue (ARR)—which inherently displays unimpressive growth because labs are severely compute-constrained—might overpower the market’s latent perception of their compute-unconstrained ARR potential. If the underwhelming actual ARR dictates market sentiment, it will lead to further capital starvation.
Ultimately, this creates a self-reinforcing cycle. Once we hit the tipping point, there is no turning back, and the market must veer off the middle path, ushering in a new AI winter.
If AI labs do generate sufficient revenue to maintain market confidence, this middle path eventually must reach our first scenario: Economically Transformative AI. To justify the $1 trillion in projected 2027 CapEx (roughly 3.6% of 2025 GDP) on assets with merely 2- to 6-year useful lives, AI’s share of the economy must aggressively expand to a high single-digit percentage of GDP.
This scenario carries tremendous implications for short-term unemployment. AI revenues can only be derived from two sources: executing existing tasks or inventing new ones. Because markets are dynamic adaptive systems, the discovery of entirely new commercial use cases is rationally impossible, but rather done through trial and error: a slow process that AI barely accelerates. Conversely, existing tasks have well-defined goals and codifiable procedures, making their execution a prime target for immediate AI automation. While human jobs involve complex orchestration and responsibility delegation, a massive share of current labor remains fundamentally unidimensional. Therefore, AI automation will displace existing roles far faster than the market can invent new ones, mandating aggressive rate cuts and confirming our sector allocation.
Concluding, the AI trade can not stall for long, and either way it ends up we will benefit through our industry selection.
Key Portfolio Positions
Mannkind Corporation ($MNKD)
MannKind Corporation ($MNKD) has recently dropped more than 50% following partner United Therapeutics’ announcement of a competing soft mist inhaler known as TreSMI – the patent was disclosed for years, and we believe that the pre-drop price already reflected this risk. The post-drop price reflected a worst-case scenario for royalties and minimal value for existing commercial assets with zero value assigned to the pipeline. Given our view of market structure, and the facts that TreSMI patents were well known beforehand indicated that our counterparty was relatively uninformed, made us comfortable with underwriting this risk at a massive size.
By underwriting the individual segments through an ownership-agnostic framework, we arrived at a total floor value of $5.33 per share, still representing a massive premium to the rebounded share price of +$3.50. We arrive at this sum-of-the-parts valuation by assigning $1.11 per share to the Tyvaso DPI royalties, based on sandbagged management guidance, and adding $0.48 per share for the United Therapeutics manufacturing contract, supported by binding purchase minimums through 2031. For the proprietary commercial portfolio, we attribute $1.28 per share to the expanding Afrezza franchise alongside $1.82 per share to the Furoscix franchise, which will soon be supercharged by an upcoming high-margin autoinjector launch. Factoring in $0.64 per share of net debt the market’s pricing at the initiation of our position assigned a negative implied value of -$1.22 per share to the MNKD-201 pipeline and the rest of the firm. In reality, we value this orphan lung pipeline at a conservative $1.28 per share, by cutting competitor’s Avalyn Pharma’s pipeline value in half. Ultimately, we are buying a highly predictable royalty and hardware business at a discount while acquiring a rapidly growing commercial portfolio and pipeline entirely for free. Due to their margin of safety we were not afraid to bet large and Mannkind currently represents 13% of our portfolio.
Perma Fix Environmental Services ($PESI)
Permafix’s Northwest facility is the only facility licensed to handle nuclear waste within the state of Washington, directly located next to Hanford. This proximity is vital, as the Hanford Site is one of the world’s largest and most expensive environmental cleanup projects, tasked with treating radioactive tank waste at an estimated total lifecycle cost of $364 billion to $589 billion. Permafix already secured a 10-year contract for treating effluent waste from the WTP plant with an annual value of $100 million, and the contract is expected to be extended until the 2050s at least. This provides us with a floor value of $16 per share.
Not all waste is expected to be treated via the WTP, and recently a tender was written with a total value of up to $4 billion to treat waste until 2040. There are only 3 players in the entire country capable of handling the waste, with PESI being the only local player, with the other 2 competitors located in Utah and Texas respectively. Due to the proximity of the Northwest facility Permafix possesses a cost advantage, and we expect them to win the majority of the contract that is to be awarded around July. Due to high operating leverage in the business, even with conservative estimates this will provide additional $10 per share of value. As per the time of writing the stock is trading sub $10, checking all 3 of our “boxes”: Asymmetric, margin of safety, and short term catalysts.
Snap Inc. ($SNAP)
Snap Inc. ($SNAP) is currently priced as a structurally impaired digital advertising business that serves as the CEO’s personal piggy bank for his passion projects.
Current consensus ignores how open-sourced deep learning architectures (like Transformers and DLRMs) are democratizing post-ATT signal recovery, even for low sophistication technical teams.
The improved targeting playbook is already proven by AppLovin ($APP), which saw revenue per install jump 72% YoY FY 25 after rebuilding its ad engine on deep learning. Despite its North America-centric user base boasting an estimated average disposable income at least 2x higher than its peers, Snap currently generates the lowest $/minute spent per user among major social platforms. By leveraging these models across 483 million DAUs, Snap can quickly amortize the development cost of newer targeting systems. While the nature of the platform inherently limits targeting efficacy as user activity on Snapchat is not highly indicative of consumer preferences, we believe that with current models, Snap could at least 3X ARPU in less than 2 years, partially due to their favorable geography of their user mix.
Historically, the market has been waiting on the sidelines due to the co-founders’ >99% voting control and unchecked AR spending. This overhang is finally resolving. Following activist Irenic Capital’s public campaign to force an AR-division separation, an April 2026 8-K confirmed management’s (partial) capitulation: a 1,000-person layoff driving over $500 million in annualized savings and a $150 million cut to stock-based compensation. We value Snap using a conservative framework that accounts for the “Spiegel discount”. Applying a peer-average 4.5x EV/Revenue multiple to $6.5 billion in 2026E revenue yields a $29.25 billion core enterprise value. Subtracting a punitive $10.0 billion perpetuity discount for AR cash burn and $0.65 billion in net debt, we arrive at an $11.00 per share price target.
Opera Limited ($OPRA)
Opera Limited ($OPRA) is heavily discounted by a market mischaracterizing it as a legacy browser structurally exposed to LLM driven search-engine erosion. In reality, Opera has built an insulated footprint through deliberate demographic segmentation, deploying specialized products like Opera GX for gamers. This captive distribution network is coupled with a margin of safety: a significant hidden equity stake in OPay, a hyper-growth African fintech platform. Underwriting the business through our segment-focused framework reveals that even under the extremely conservative scenario where query-based ad revenue compresses to zero, Opera retains immense intrinsic value. Crucially, query-based ads represent only ~33% of Opera’s advertising mix; the remaining 67% comes from speed dials and banners placed on the starting page’s news feed, which are highly AI-resilient. This distribution is currently experiencing a structural catalyst courtesy of the EU’s Digital Markets Act (DMA), which decimates the historical pre-bundling advantage of incumbents by forcing every new digital phone subscriber to actively choose their browser at setup.
While traditional search queries might eventually be rerouted to external AI models, Opera has numerous avenues to capture value directly through its user interface. Its highly specialized products create sticky customers because features can be tailored to specific user cohorts instead of bending to the generic needs of a mass audience.
As AI disruption shifts browsing habits, Opera can leverage its “digital real estate” to capture alternative revenue streams—such as routing transactions through its default native payment wallet, MiniPay. Stripping out the high-growth OPay equity stake leaves a core enterprise value for the browser business of just $1,071 million as per July 12th. At this implied price, the business trades at a dirt-cheap 2.6x EV/GM multiple. Driven by highly efficient operational cash generation, this maps to a lean 7.3x EV/OCF multiple, making Opera incredibly cheap given double digit top line growth with high operating leverage.
Federal Agricultural Mortgage Corp ($AGM)
Federal Agricultural Mortgage Corp ($AGM) is a federally chartered GSE that operates mainly in the secondary agricultural mortgage market. Rather than originating loans, Farmer Mac functions as a liquidity provider for regional farm banks, purchasing mortgages and providing off-balance-sheet guarantees that free up local capital.
Standard screeners often flag the company as dangerously over-levered. However, this is an optical illusion: regulatory risk weights overstate the real risk of the balance sheet. Due to these incorrect risk weights, Farmer Mac looks heavily levered, whereas in reality, we believe its capitalization is overly prudent.
The disconnect lies in how regulators evaluate the core Farm & Ranch portfolio. Because agricultural commodities are highly cyclical, the probability of default is admittedly high. However, the loss given default is minimal, as the loans are capped at a 70% LTV, with median LTV hovering around 50%, collateralized by structurally appreciating farmland and further insulated by federal crop insurance programs.
Moving loss given default by only a couple of basis points, up from the real basis of <5 bps, massively increases credit risk estimates – this minimal regulatory caution skews off estimates and saddle AGM with an artificially punitive ~60% risk weight, for an asset class that had 11 bps of historical cumulative losses. Furthermore, because Farmer Mac is funded by long-term debt rather than customer deposits, there is strictly zero duration or liquidity risk involved—factors that should be accurately accounted for when considering its leverage ratios.
Freed from the constraints of traditional depositories, AGM can comfortably expand its balance sheet while sustaining 16.5% to 18% ROEs. By recognising the fact that its earnings do not come from excessive leverage, but prudent risk taking and zero-duration mismatch, our mid range sensitivity analysis yields a conservative fair value of $247 per share—10% EPS growth for the 5 year explicit period and a 4% terminal rate. Ultimately, AGM is a generational, quasi-sovereign compounder trading at a steep discount simply because rigid regulatory models cannot contextualize its unique advantages.